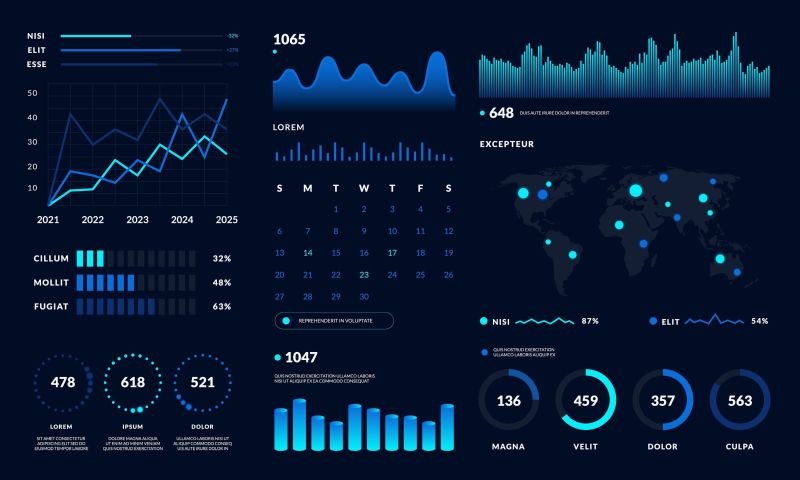
Monitor your key performance indicators and create stunning dashboards using Microsoft's world-class data visualization tool.
We will work with you to determine the best visualizations and dashboards to bring your data to life.
We work not just to display charts and graphs, but also to embed any corporate design and branding for your data portals.

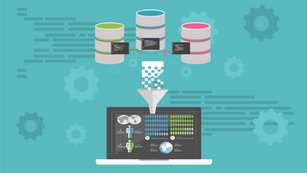
We can work with a wide variety of data, including text files, Excel spreadsheets, extracts from systems such as Salesforce, databases such as SQL Server, Postgres, and Oracle, and other cloud platforms.
Not all data points come pre-calculated from a data source. Using DAX, Power Query, and Power BI expressions we can crunch the numbers on the fly to give you much more than what is available in your raw data - trends, rolling averages, forecasts, and more.

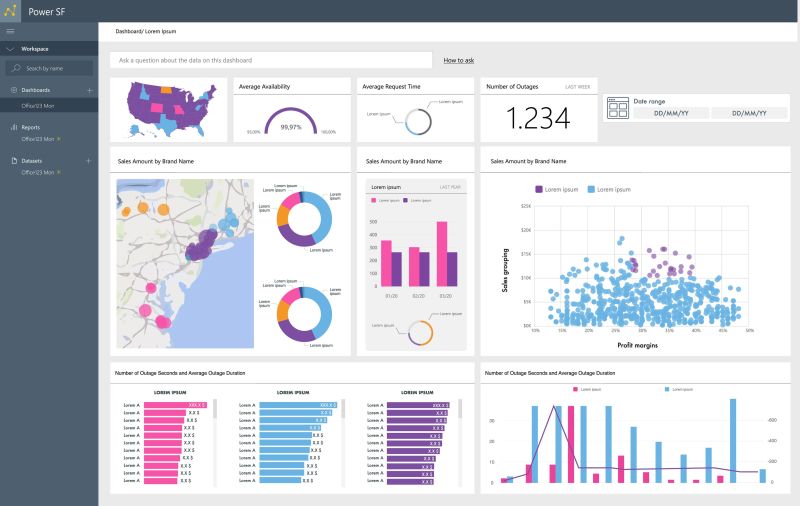
Are you an Azure cloud customer? We can deploy your dashboards to an Office 365 Power BI Workspace, integrate with your Power Automate workflows, and provide secure access to your dashboards via Azure Active Directory.
Synthelize has revolutionized the manner in which our statewide non-profit program tracks, analyzes, and leverages data to improve our outreach efficiency, planning, and effectiveness. . .Synthelize has created an advanced online dashboarding system unique to our program that allows our team to see overall trends, categorize program data and effectiveness, and drill-down into specific areas to crosswalk demographics with program strategizes.
“Synthelize has been an absolute pleasure to work with. Toby always goes above and beyond with all of my requests, and his analysis and report creations are always top-notch. I can't recommend their services enough.”
322 North Shore Drive
Building 1B, Suite 200
Pittsburgh, PA 15212
I am interested in information on: