In this series we have explored Microsoft Excel from a data governance perspective, learning why Excel is not a great database and why Excel is not a great analytics platform. We also examined some good uses of Microsoft Excel. In this final article we look at how to evaluate your organization's use of Excel and how to make some changes in your data strategy to move beyond Excel into more robust databases and data storage platforms.
Here are three scenarios where it makes sense for an organization to make heavy use of Excel for data storage and/or data analysis.
Step 1: Identify the key spreadsheets being used by each department in your organization and determine what data is ONLY being entered into that spreadsheet.
It is OK to use Excel for data tracking; however, any data that is ONLY being tracked in spreadsheets is prone to all kinds of data governance problems. Here are some of the things that can happen to data that is ONLY being stored in an Excel spreadsheet:
Step 2: Find more robust systems to store the data that is currently only in spreadsheets.
Many departmental data platforms have the ability both to track "standard" data and to create custom forms to store custom data. It is often advantageous to move tracking of this custom data from individual spreadsheets to these data platforms. If a good data platform is not available for the data, there may be an organizational database such as SQL Server or Oracle or Postgres that can support linking data entry from Excel directly into the database. This allows the convenience of entering data in Excel but deferring the storage to a more robust and centralized data platform.
At the very least, if no other suitable platform can be found for the data, be sure to back up the spreadsheet regularly to a different location.
Step 3: Identify the "monster spreadsheets" in your organization
Almost every spreadsheet has what we would call a "monster spreadsheet". This is a spreadsheet which is assembled by multiple people in different departments and is presented to executives on a monthly or quarterly basis and is used for decision making and projections. These spreadsheets grow over time, and may outlive some of the people who originally developed them.
These spreadsheets often grow so large and interconnected that it is difficult to change them. This leads to a roadblock in organizational business intelligence - so much is invested in THE SPREADSHEET that no one wants to change it and no one wants to find alternatives either.
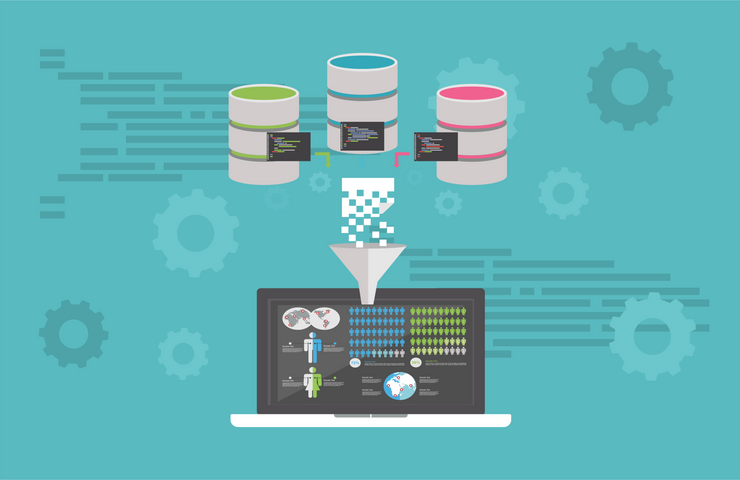
Step 4: Move the data from the "monster spreadsheets" into a data warehouse.
When an organization has a monster spreadsheet it is usually a sign that what it really needs is a data warehouse. The process of building this data warehouse takes significantly more time and resources initially than maintaining the "monster spreadsheet". However, if you do not make the transition eventually the organization's business intelligence will grind to a halt for lack of better options.
Step 5: Use version-controlled data transformation logic to transform the raw data in the data warehouse into actionable, drillable formats.
When an organization has a monster spreadsheet it is usually a sign that what it really needs is a data warehouse. The process of building this data warehouse takes significantly more time and resources initially than maintaining the "monster spreadsheet". However, if you do not make the transition eventually the organization's business intelligence will grind to a halt for lack of better options.
Step 6: Use custom reporting tools such as Tableau and Power BI to create rich views of the data warehouse data.
It is much easier to create rich views of data when the data is being stored centrally and the data is massaged using predefined calculations into a report friendly format. From this launching point business analysts can use Tableau and Power BI and yes, even Excel (coming full circle) to create great visual reports and dashboards.
We hope you have learned much from this deep dive into Microsoft Excel from a data governance perspective and that this series of articles inspires your organization to take your business intelligence to the next level. As always, Synthelize is here for you to provide personalized data consulting for your organization's unique needs.
Synthelize has revolutionized the manner in which our statewide non-profit program tracks, analyzes, and leverages data to improve our outreach efficiency, planning, and effectiveness. . .Synthelize has created an advanced online dashboarding system unique to our program that allows our team to see overall trends, categorize program data and effectiveness, and drill-down into specific areas to crosswalk demographics with program strategizes.
“Synthelize has been an absolute pleasure to work with. Toby always goes above and beyond with all of my requests, and his analysis and report creations are always top-notch. I can't recommend their services enough.”
322 North Shore Drive
Building 1B, Suite 200
Pittsburgh, PA 15212
I am interested in information on: