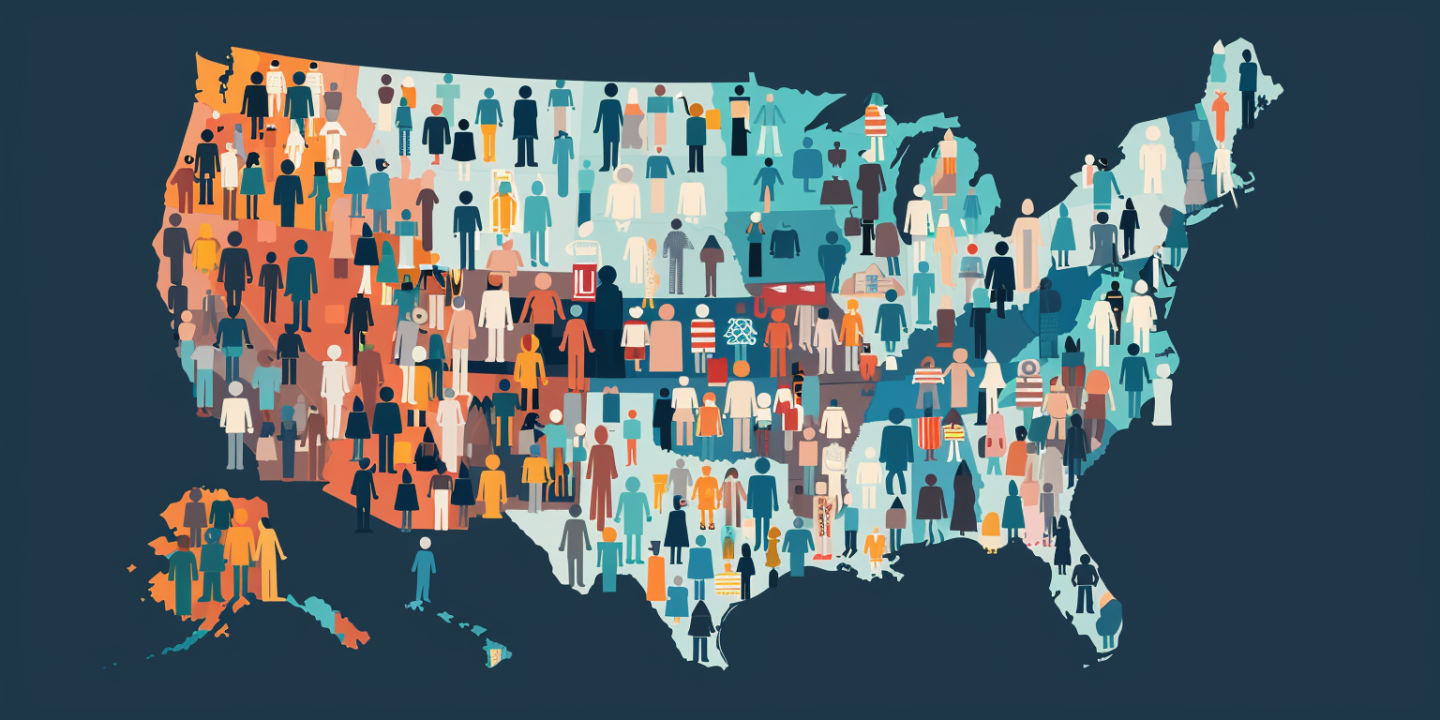
Nonprofit client that works with elderly population in Pennsylvania wanted to look at demographics to better plan and target outreach. They were particularly interested in the Spanish speaking population of Pennsylvania, which they feel they could serve better by providing flyers and social media posts in Spanish. The challenge was to find the intersection of the 65+ population in Pennsylvania and overlap it with areas that have a high concentration of Spanish only speakers.


The American Community Survey is an ongoing survey conducted by the U.S. Census Bureau that gathers detailed demographic, social, economic, and housing information about the U.S. population. Unlike the decennial census, which provides a snapshot every ten years, the ACS provides more current data, collected annually, to give communities timely insights into changes and trends.
The ACS covers a wide range of topics, including education, employment, income, housing characteristics, and migration patterns. This comprehensive data collection helps inform public policy, community planning, and resource allocation at the local, state, and federal levels. By understanding the diverse needs and characteristics of communities, decision-makers can better address issues related to infrastructure, education, healthcare, and economic development.
The survey reaches approximately 3.5 million households each year, making it one of the largest and most reliable sources of demographic information in the United States. The data collected is used not only by government agencies but also by researchers, businesses, and non-profit organizations to analyze trends and plan for the future.
Synthelize created a C# web application backed by a Postgres data mart and hosted on AWS. It then downloaded the relevant data files of the American Community Survey and loaded them into the data mart. Because the data contained in the files was aggregated at the zipcode level, Synthelize performed aggregate calculation to give a county view as well.
Synthelize considered a number of technologies to perform the data mapping and settled on geographic maps powered by the open-source D3 javascript library for data visualization.
Using D3 had the following advantages:
The client felt that the demographic maps greatly enhanced their ability to perform outreach. By visualizing the distribution of different population groups, they could identify key areas where their services were most needed. This enabled them to tailor their outreach strategies to specific communities, ensuring that their messaging and programs were relevant and impactful. The ability to see demographic data on a map also made it easier for the client to plan events, coordinate volunteer efforts, and engage with local stakeholders more effectively.
Moreover, the demographic maps helped the client target their limited resources in areas where they could most have an impact. Instead of spreading their efforts thinly across a broad region, they could focus on high-need areas identified through the maps. This strategic allocation of resources meant that their interventions were more likely to succeed and produce measurable results. The client could also use these maps to track the progress of their initiatives and adjust their strategies based on real-time data, maximizing the efficiency and effectiveness of their work.
Synthelize has revolutionized the manner in which our statewide non-profit program tracks, analyzes, and leverages data to improve our outreach efficiency, planning, and effectiveness. . .Synthelize has created an advanced online dashboarding system unique to our program that allows our team to see overall trends, categorize program data and effectiveness, and drill-down into specific areas to crosswalk demographics with program strategizes.
“Synthelize has been an absolute pleasure to work with. Toby always goes above and beyond with all of my requests, and his analysis and report creations are always top-notch. I can't recommend their services enough.”
322 North Shore Drive
Building 1B, Suite 200
Pittsburgh, PA 15212
I am interested in information on: